
The science behind the prediction.
MAPP reads fluorescent signals from the algae living inside coral tissue. Those signals reveal how well the cells are coping with light and heat stress. Our models turn them into a thermal-tolerance estimate for each colony.
MAPP: Multispectral Aquatic Photosynthesis Profiler
MAPP is a submersible fluorometer that non-destructively measures a coral colony's physiological health in minutes. It excites the coral's symbiotic algae at four wavelengths (~420, 448, 470 and 505 nm) and records the chlorophyll fluorescence they produce.
The production design is a compact, wrist-mounted unit with a flexible fibre-optic probe, built for use by divers and snorkelers in the field. Software and online training videos are included.
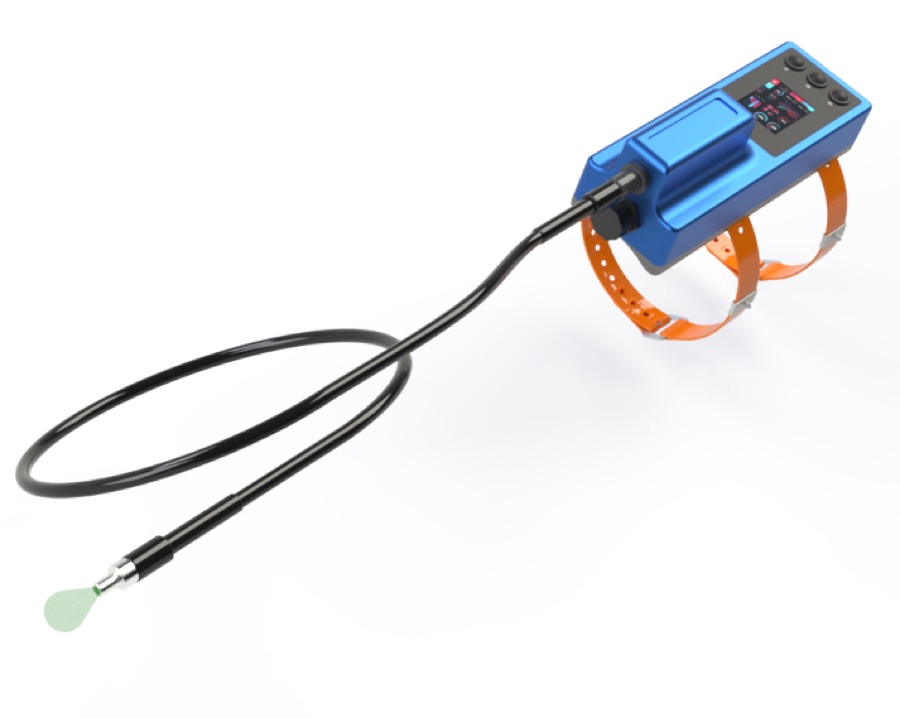
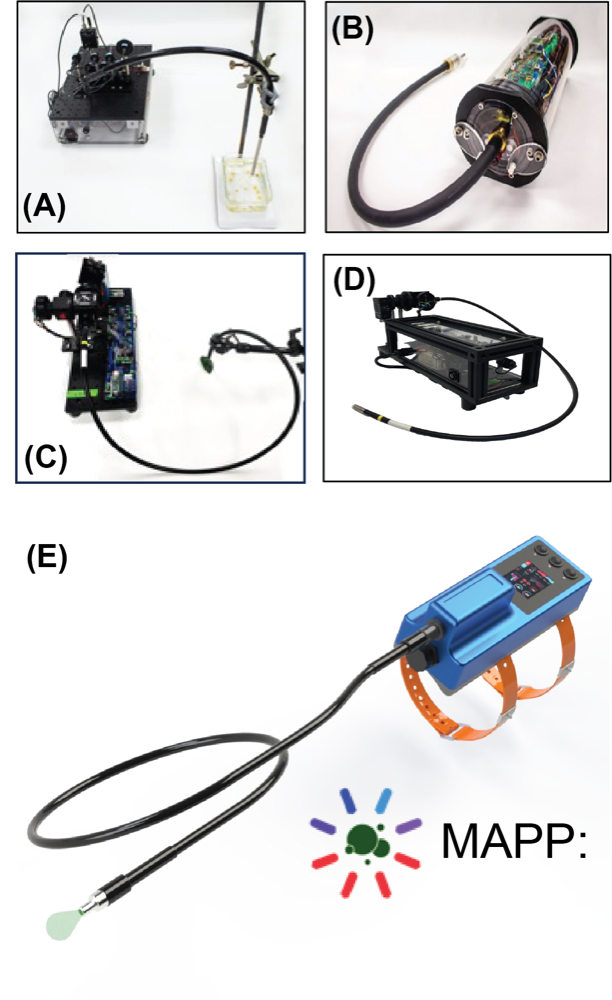
From the 2021 prototype (A) through the 2022–2024 upgrades (B–D) to the production design (E).
Five years of field-tested refinement
With research and development funded by the National Science Foundation, National Geographic Society, NOAA and CORDAP, the instrument has moved from a benchtop prototype to a field-ready, submersible tool built to be easy to use for researchers and restoration practitioners.
- 2021
Benchtop prototype proves the light-response method on coral fragments.
- 2022–2024
Successive upgrades take the system underwater and onto reefs in Fiji, Guam and Florida.
- 2027
First production units ship (June–August) in a submersible housing.
One standardised, five-minute light-response run
Every MAPP measurement follows the same protocol. The light source steps through a dark baseline, three light levels and a dark recovery, while MAPP continuously fires flashes and records the fluorescence response at each of its four excitation colours.
| Stages | What happens |
|---|---|
1 | Dark-adapted baseline: the reference every other stage is compared to. |
2 | Multi-turnover flash drives photosystem II fully closed. |
3–9 | Light step L1, ~300 µmol m⁻² s⁻¹ |
10–15 | Light step L2, ~100 µmol m⁻² s⁻¹ |
16–22 | Light step L3, ~500 µmol m⁻² s⁻¹ |
23–27 | Recovery in the dark |
At every stage, single-turnover and multi-turnover flashes are fitted as curves, giving quantum yield, antenna size, connectivity, relaxation kinetics, and photochemical and non-photochemical quenching.
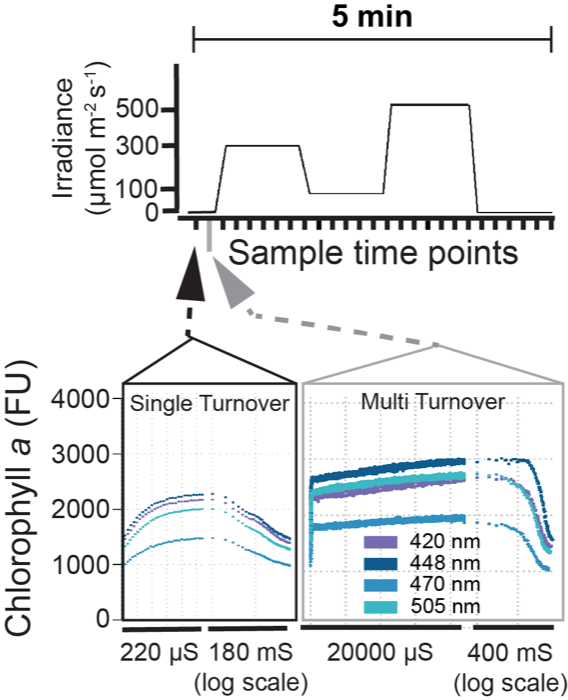
Irradiance program (top) and the chlorophyll a transients captured at a single sample time point (bottom).
From raw scans to ~4,200 named metrics
Upload the raw files from the instrument to the cloud and processed, analysis-ready data comes back in about ten minutes. Each measurement expands into six families of documented metrics:
| Family | What it captures |
|---|---|
| Base metrics | Each fitted quantity (yield, cross-section, quenching, kinetics…) at every stage and colour. |
| Light-stage summaries | Mean, min, max, range and slope of a metric across a whole light phase. |
| Light-response ratios | Fractional change between two individual stage readings. |
| Stage-average ratios | Fractional change between two whole-phase averages. |
| Induction–relaxation points | Turning points of the raw fluorescence trace itself, independent of curve fits. |
| Channel ratios | Maximal fluorescence compared across excitation colours. |
The Data Hub also hosts curated reference datasets from partner reefs, so your corals can be compared directly with published collections. Every metric name, with a plain-language definition and its exact formula, is documented in the app's Metric Reference ↗.
Trained on real bleaching outcomes, tested on new reefs
Each model learns from MAPP scans taken before a thermal-stress event, paired with how those same corals actually responded, whether in an experiment or a natural heat wave.
Data prep
Align metric panels across reef sites; drop columns with excess missingness, no variance, or cross-site drift.
Feature selection
Boruta stability selection across repeated subsamples keeps only consistently informative metrics, then prunes redundant ones.
Training
A small, regularised neural network (Keras/TensorFlow) is fit to the training reef's data.
Validation
Settings are tuned by nested, leakage-aware leave-one-out cross-validation, with features re-selected inside every fold.
Cross-site test
The final model is scored once on a second reef site it never saw, the closest proxy for performance on a new reef.
Turn predictions into restoration decisions
Browser-based tools that work on your own samples and on the curated reference datasets.
Bleaching predictions
Estimate a thermal-tolerance outcome for every uploaded colony, shown as a sortable ranking.
Functional analysis
Cluster colonies into groups that share similar photosynthetic strategies and light-stress handling.
Photochemical profiles
Compare light-response curves and derived metrics side by side across sample groups.
Group comparison
UMAP or NMDS ordination shows how similar nurseries, sites or genotypes are overall.
Try it with the reference datasets
The Data Hub and Analytics Studio are open in your browser. Allow up to a minute for the app to wake.
Published literature
The research behind MAPP and its phenomic approach.
A phenomic modeling approach for using chlorophyll-a fluorescence-based measurements on coral photosymbionts
Frontiers in Marine Science, 2023
Read the paper ↗Cellular traits regulate fluorescence-based light-response phenotypes of coral photosymbionts living in-hospite
Frontiers in Physiology, 2023
Read the paper ↗Bio-optical signatures of in situ photosymbionts predict bleaching severity prior to thermal stress in the Caribbean coral species Acropora palmata
Coral Reefs, 2024
Read the paper ↗Want MAPP for your program?
Reserve a unit from the first production run. It's free, and nothing is charged until you confirm.